Summary
IIoT can improve a manufacturing company’s asset utilization ratios and the production line’s up-time to produce significant savings in maintenance costs. This is illustrated through the P-F curve method of condition-based maintenance.
Causes of Failure Vary
Let’s start with the basics. Failure of an asset or piece of equipment is a process, not an event. The common leading causes of failure in equipment include wear, stretch, deterioration, misalignment, and contamination. Each of these failure causes can develop over time. Additionally, the time from the start of a cause of failure to the actual point of failure (i.e., the functional failure) can vary. Therefore, these causes don’t lead to failure immediately, nor all at once. However, failure can and does eventually occur from one or more of these causes. Therefore, the failure of an asset is a process that occurs over time based on how the machine is utilized and treated.
The good news is that failure takes time to happen. This provides an opportunity for maintenance staff to identify potential failures and apply fixes, to prevent or reduce the consequences of the failure.
Fixing equipment after it fails is called Reactive Maintenance. Unfortunately, it is an all-too-common method of identifying and fixing issues with equipment and has expensive consequences. Failure of equipment leads to lost production time, costly fixes, or asset replacement.
The preferred approach for the maintenance of equipment is to avoid failure altogether. We can maintain the physical assets in such a way as to avoid the consequence of failure, whatever the cause.
Consequences of Failure Are Expensive
The causes of failure can vary from small to significant. If the causes are negligible, maintenance staff may choose to do nothing.
However, the costs or consequences of failure can be significant, such as loss of production of the asset, loss of the asset such that it has to be completely replaced, or shutdown of a whole production line. In these cases, it makes sense to put forth the effort to detect the failure “process” as early as possible before failure. At that point, maintenance staff can take corrective action required to avoid the failure or at least reduce the consequences.
The performance of the equipment will degrade over time, from the point the potential failure starts through to the functional failure. The cost of fixing a potential failure often will be lower if the cause of failure is identified and fixed earlier.
P-F curve
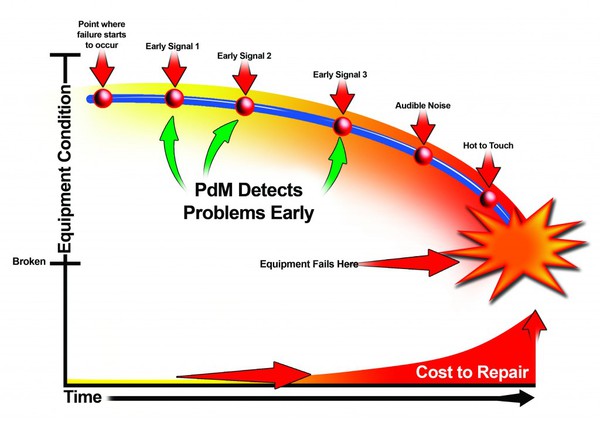
The P-F curve (illustrated here) illustrates the progression of behaviors of an asset over time and the increasing costs of addressing those behaviors.
In the P-F curve, the X-axis represents time, and the Y-axis represents the condition of the asset. On the curve, a potential point of failure–one of the various causes referenced in the previous section– will occur early on the timeline. That is the point at which a failure cause first manifests and may potentially be detectable. Over time, across the X-axis you can see the decrease in the condition of the asset. That degradation of condition will exhibit itself in various forms, each of which should be detectable.
The P-F curve illustrates the interval between the point of potential failure (earliest point of a detectable behavior which indicates eventual failure) and the functional failure, and the behaviors that are exhibited over that period of time are important.
This progression of behaviors and deterioration of the condition of the asset over time means it is best to identify the failure cause, i.e., potential failure, as early as possible before the failure of the asset, and fix it. Additionally, the P-F curve illustrates how the cause of potential failure will be less costly to prevent earlier in the timeline. Exercising proper asset utilization and collecting important data will assist you in avoiding machine failure.
Here is an example of the change in behaviors over time and the costs for failure prevention on a P-F curve: The potential failure could be detected early in the process in lubricant oil through analysis. One cause might simply be that the oil is old and needs to be changed. That can be a relatively inexpensive fix. If not addressed, however, it could then deteriorate to a vibration. Data about the vibration would need to be obtained and analyzed. Eventually, the use of IR thermography may detect heat whereas a human may not easily detect the heat caused by friction. At these points, the issue could possibly be addressed with inexpensive fixes such as additional lubrication or replacing a part. The issues could eventually progress to audible noise, heat detectable by a human, and smoke. These conditions could cause other problems with the equipment which would increase the time and costs of fixing the equipment. If not addressed, the equipment will eventually reach the point of functional failure. That is the point at which the costs for fixing the issue are highest.
A CBM Program Can Help
Companies can put a Condition-Based Maintenance (CBM) program in place to systematically identify and address potential failures earlier than otherwise possible and save significant costs and time.
Detection of potential failures with condition-based maintenance historically is done by regularly scheduled inspections. Maintenance staff will visit and review the condition of the asset on a fixed schedule. That schedule could be defined in a number of ways, including usage of the asset (number of hours of usage), productivity (number of parts processed), or the calendar (every 2 weeks or every 6 weeks). Some common condition monitoring techniques are vibration measurement and analysis, infrared (IR) thermography, process parameter trending (e.g., temperatures, pressures, rates, flows, etc.), visual inspection, corrosion monitoring, and others.
With this method, the inspection intervals must be shorter than the interval from potential failure to functional failure.
The problem is those manufacturing companies are challenged with reducing expenses and staff, while at the same time maintaining and increasing asset utilization. To be clear the asset utilization formula is a measure of how much the asset is available for producing products versus how much it’s scheduled to be available. Any maintenance staff team member might struggle to visit and inspect every machine on the required schedules. This is especially true for manufacturers that have a large number of assets or where many of those assets are in remote locations relative to the maintenance staff.
IIoT to the Rescue
IIoT can be integrated into a company’s CBM program to automate monitoring and analysis of equipment behaviors. In an IIoT solution, data can be pulled from sensors on equipment, analyzed, and eventually converted into valuable information. The IIoT solution can constantly monitor every asset — 24 hours a day, 7 days a week, x365 days a year. The maintenance staff can then see the status of all of their equipment from any location, can assess the causes and severity of the potential failures earlier in the P-F curve, and then optimize their personnel and financial resources to address potential failures.
This allows the maintenance staff to then be more proactive, focusing on issues earlier. It also translates to reduced costs of maintenance and prevents the costs of lost production time. As a result, the manufacturer will see higher asset utilization ratios for the assets, and thereby attain greater production uptime, which can be expressed in improved OEE (Overall Equipment Effectiveness).