Manufacturing Downtime and OEE: How to Use the Data
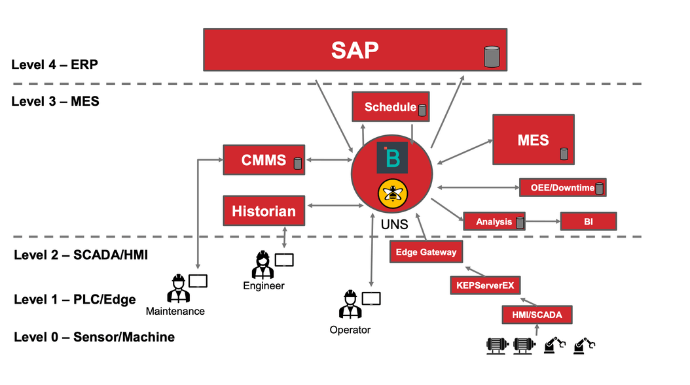
- Start with collecting the data and converting it to useful information such as downtime and OEE
- Then provide it to your team on a tablet, a computer next to a machine, or even a big screen tv in the plan.
You’re now looking at real-time data about your machine equipment states and events. You’re getting a real view of your capacity performance constraints measured against baselines with manufacturing downtime, starving, idle, and shortstops. When looking at the data, machine patterns will often reveal themselves and you can gain a new understanding of actual capacity, product materials, throughput, and promised delivery metrics.
You’ll understand 1) where your actual capacity and production is at, and 2) how machines are actually performing to enable that capacity, including the types of manufacturing downtime. You can then use the actual machine data to troubleshoot and solve particular issues. For example, it’s possible in some cases where getting data on OEE and then solving problems to improve OEE by 10% can result in an increased capacity of 19% with better efficiency and throughput. That can then result in increased operational net revenue which results in improved product margins.
Two key issues to consider are education and culture:
- Education: Companies will need to ensure teams are educated such that they accurately understand what the data means, and what actions they are empowered to take which will have a positive result on the machine data they see.
- Culture: Awareness of the culture on the plant floor is important. There can be a perception of a big brother when operators and shop managers know that management can more accurately see what they’re doing and not doing. However, the culture can be developed such that staff can welcome opportunities to do a better job, to improve production capacity, quality, etc.
Manufacturing Downtime Use Cases
Sometimes data concepts can seem abstract, so here we will provide two real use cases.
Food Plant
- Situation: Food production plant processing 980K lbs product per day to make broths and fat products. They used 6 different boxes and fluidized dryers in the drying process.
- Problem: The plant was steadily losing capacity over multiple months which seemed to point to excessive downtime in their dryers and evaporators. Data collected manually showed a 14-day schedule with 6-minute downtime cycles but upon investigation, they discovered excessive downtime with their dryers and CIP processes.
- Solution: Invested in a real-time data collection and process visualization system with OEE to track manufacturing downtime with performance measure metrics.
- Result: Collecting real-time data and OEE showed improvements could reduce downtime by 25-50% with an OEE index of 60%. This converted to savings on the evaporators and dryers between $760K-$1.5M in cost avoidance over a 12-month period with a recovery of 25%-50% in plant equipment capacity and 10-20% product material loss recovery.
How to Use the Data
How can you use data from your machines like downtime data to improve your production capacity? How can data be used to improve scheduling, reduce waste, use, or materials efficiently?
- Start with collecting the data and converting it to useful information such as downtime and OEE
- Then provide it to your team on a tablet, a computer next to a machine, or even a big screen tv in the plan.
You’re now looking at real-time data about your machine equipment states and events. You’re getting a real view of your capacity performance constraints measured against baselines with downtime, starving, idle, and shortstops. When looking at the data, machine patterns will often reveal themselves and you can gain a new understanding of actual capacity, product materials, throughput, and promised delivery metrics.
You’ll understand 1) where your actual capacity and production are at, and 2) how machines are actually performing to enable that capacity, including the types of manufacturing downtime. You can then use the actual machine data to troubleshoot and solve particular issues. For example, it’s possible in some cases where getting data on OEE and then solving problems to improve OEE by 10% can result in an increased capacity of 19% with better efficiency and throughput. That can then result in increased operational net revenue which results in improved product margins.
Two key issues to consider are education and culture:
- Education: Companies will need to ensure teams are educated such that they accurately understand what the data means, and what actions they are empowered to take which will have a positive result on the machine data they see.
- Culture: Awareness of the culture on the plant floor is important. There can be a perception of a big brother when operators and shop managers know that management can more accurately see what they’re doing and not doing. However, the culture can be developed such that staff can welcome opportunities to do a better job, to improve production capacity, quality, etc.
This article is just one part of a four-part series, check out our article on how to get the data.


